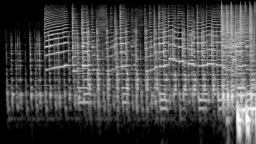
Spectrogram
This article is a stub. You can help the Hydrogenaudio Knowledgebase by expanding it.

A spectrogram is a graph showing the distribution of energy between frequency bands over time.
The data that is necessary to create such a graph is gathered by transforming time domain (PCM) data to frequency domain, e.g. using FFT.
