Spectrogram: Difference between revisions
No edit summary |
No edit summary |
||
| (3 intermediate revisions by 3 users not shown) | |||
| Line 1: | Line 1: | ||
A spectrogram is a graph showing the distribution of energy between frequency bands. | {{Stub}} | ||
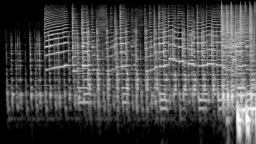
[[File:variable q spectrogram.png|256px|thumb|A spectrogram of a short song segment.]] | |||
A spectrogram is a graph showing the distribution of energy between frequency bands over time. | |||
The data that | The data that is necessary to create such a graph is gathered by transforming [[time domain]] ([[PCM]]) data to [[frequency domain]], e.g. using [[FFT]]. | ||
[[Category:Signal Processing]] | |||
[[Category:Technical]] | |||
Latest revision as of 07:05, 1 July 2023
This article is a stub. You can help the Hydrogenaudio Knowledgebase by expanding it.

A spectrogram is a graph showing the distribution of energy between frequency bands over time.
The data that is necessary to create such a graph is gathered by transforming time domain (PCM) data to frequency domain, e.g. using FFT.
