Foobar2000:Components/Spectrum Analyzer (foo vis spectrum analyzer): Difference between revisions
| Line 473: | Line 473: | ||
[[File:foo_vis_spectrum_analyzer_visualization.png|thumb|256px|Spectrum Analyzer Configuration: Visualization]] | [[File:foo_vis_spectrum_analyzer_visualization.png|thumb|256px|Spectrum Analyzer Configuration: Visualization]] | ||
'''Type''' | |||
Determines the type of visualization: | |||
* Bars: The classic spectrum visualization | |||
* Curve: The same as bars but with a smoothed curve instead of bars. | |||
* Spectogram | |||
* Peak Meter | |||
==== Peak indicators group ==== | ==== Peak indicators group ==== | ||
Some visualizations can display indicators for the peak values. The following settings determine how those peak indicators are animated. | |||
'''Peak mode''' | '''Peak mode''' | ||
Specifies how the peak indicators are rendered | Specifies how the peak indicators are rendered: | ||
* None | * None | ||
| Line 485: | Line 496: | ||
* AIMP | * AIMP | ||
* Fade Out | * Fade Out | ||
* Fading AIMP | * Fading AIMP: A combination of AIMP and Fade Out | ||
'''Hold time''' | '''Hold time''' | ||
Specifies how long a peak value will be held steady. | Specifies how long a peak value will be held steady before it decays. | ||
'''Acceleration''' | '''Acceleration''' | ||
Specifies the acceleration used to | Specifies the acceleration used to decay the peak value. | ||
==== LEDs group ==== | ==== LEDs group ==== | ||
Some visualizations can display a bar as simulated LED lights. | |||
'''Enabled''' | |||
Display the spectrum bars and peak meters as LEDs. | |||
'''LED size''' | |||
The size of the LED light, in pixels. | |||
'''LED gap''' | |||
The size of the gap between the LEDs, in pixels. | |||
==== Spectogram group ==== | ==== Spectogram group ==== | ||
'''Scrolling''' | |||
Activates scrolling of the spectogram. | |||
==== Peak Meter group ==== | ==== Peak Meter group ==== | ||
'''Horizontal''' | |||
Renders the peak meter horizontally. | |||
'''RMS window''' | |||
Specifies the duration of each RMS measurement (in seconds). | |||
=== Styles page === | === Styles page === | ||
Revision as of 10:53, 15 April 2024
| Spectrum Analyzer | |
|---|---|
 | |
| Developer(s) | |
| Repository | GitHub |
| Release information | |
| Stable release | 0.7.5.4 (April 13, 2024; 1 year ago) |
| foobar2000 compatibility | |
| Architecture | x86 32-bit, x86 64-bit |
| Minimum version | 2.0 |
| UI module(s) | Default UI, Columns UI |
| Additional information | |
| Use | Visualization |
| License | MIT License |
| View all components | |
A recreation of Musical Spectrum component for foobar2000 v2.x and 64-bit versions. Windows 10 or higher are the only supported operating systems.
You can double-click the component window to switch between windowed and full-screen mode. Note that when using the Default User Interface (DUI) the full-screen version is another instance of the component with its own configuration. When you use the Columns User Interface (CUI) the existing instance will be resized to occupy the full screen.
Context Menu
Right-click on the component window to display the context menu. The following options are available:
Configure
Opens the Configuration dialog.
Toggle Full-Screen Mode
Toggles full-screen mode off and on.
Frame Counter
Enables the display of a rudimentary frame counter.
Refresh Rate Limit
Allows you the selected the refresh rate of the component animation. Note that even though the component can redraw its visuals very fast the actual maximum refresh rate is usually determined by the refresh rate of your monitor.
Presets
Contains a list of previously saved presets. Select one from the list to activate it.
Freeze
Prevents the refresh of the component, effectively reducing CPU and GPU use to 0.
Configuration dialog
The configuration dialog is used to change all parameters used by the component. All changes are applied immediately to the component with the need to close it.
Closing the dialog the dialog Close button or the Cancel button reverts the configuration to the previous state.
Reset
Resets the configuration to the default values.
OK
Closes the dialog box and makes the changes to the configuration final.
Cancel
Closes the dialog box and undoes any changes to the configuration.
Transform page
Transform group
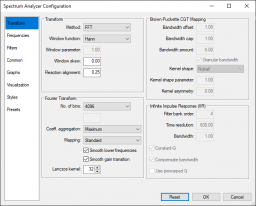
Method
Allows you to select the Time to Frequency domain transform. The following transforms are implemented:
- Fast Fourier (FFT)
- Constant-Q (CQT)
- Sliding Windowed Infinite Fourier (SWIFT)
- Analog-style
Window function
Selects the window function that will be applied to the samples (Time domain).
Window parameter
Allows you to tweak window functions that support a parameter like Gaussian and Kaiser.
Window skew
Adjusts how the window function reacts to samples. Positive values makes it skew towards latest samples while negative values skews towards earliest samples. Defaults to 0 (None).
Reaction alignment
Controls the delay between the actual playback and the visualization.
- < 0: All samples are ahead of the playback sample (with the first sample equal to the actual playback sample).
- = 0: The first half of samples are behind the current playback sample and the second half are ahead of it.
- > 0: All samples are behind the playback with the last sample equal to the current playback sample.
Fourier Transform group
Groups the parameters that influence the Fast Fourier transform.
No. of bins
Specifies the number of bins used by the transforms as a number between 64 and 32768.
- Select Custom to specify a number that is not a power of 2. This will consume a lot more CPU power.
- Select Sample rate based to specify the size as a duration. F.e. 100ms of a track sampled at 44.1kHz will result in an FFT window of 4410 samples.
Coefficient aggregation
Determines which method is used to aggregate the coefficients of FFT.
- Minimum
- Maximum
- Sum
- Residual Mean Square (RMS)
- RMS Sum
- Average
- Median
Mapping
Determines how the FFT coefficients are mapped to the frequency bins.
- Standard
- Triangular Filter Bank
- Brown-Puckette CQT
Smooth lower frequencies
When enabled, the band power part only gets used when number of FFT bins to sum for each band is at least two or more.
Smooth gain transition
Smooths the frequency slope of the aggregation modes.
Lanczos kernel
Determines the size of the Lanczos kernel. The kernel is used to create a smooth transition between the FFT coefficients resulting in a visual pleasing result.
Brown-Puckette CQT Mapping group
Bandwidth offset
Offsets the bandwidth of the Brown-Puckette CQT.
Bandwidth cap
Minimum Brown-Puckette CQT kernel size.
Bandwidth amount
The Brown-Puckette CQT kernel size.
Granular bandwidth
When disabled constrains the bandwidth to powers of 2.
Kernel shape
Determines the shape of the Brown-Puckette CQT kernel.
Kernel shape parameter
Parameter used by certain window functions like Gaussian and Kaiser windows.
Kernel asymmetry
Adjusts how the window function reacts to samples. Positive values makes it skew towards latest samples while negative values skews towards earliest samples.
Infinite Impulse Response (IIR) group
Groups the parameters used by the SWIFT and the Analog-style transforms.
Filter bank order
Determines the order of the filter bank used to calculate the SWIFT and Analog-style transforms.
Time resolution
Determines the maximum time resolution used by the SWIFT and Analog-style transforms.
Bandwidth
Determines the bandwidth used by the SWIFT and Analog-style transforms.
Constant-Q
Uses constant-Q instead of variable-Q in the IIR transforms.
Compensate bandwidth
Compensate bandwidth for narrowing on higher order IIR filters banks.
Use prewarped Q
Prewarps Q to ensure the actual bandwidth is truly logarithmic at anything closer to the Nyquist frequency.
Frequencies page
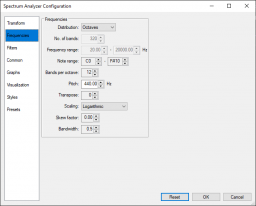
Frequencies group
Groups the parameters that determine the frequency range that will be displayed.
Distribution
Determines which parameters are used to generate the frequency bands.
- Linear: Generate frequency bands based on the frequency parameters.
- Octaves: Generate frequency bands based on the note parameters.
- AveePlayer: Generate frequency bands used by AveePlayer.
No. of bands
Specifies the number of frequency bands to generate (2 to 512) in the specified frequency range.
Frequency range
Frequency of the first and last band, 1Hz to 96000Hz. Each frequency is centered in the band.
Note range
Available when selecting the Octaves distribution. Select a range between the C note of octave 0 and B# of octave 11 (max. 144 notes or 12 octaves)
Bands per octave
Number of bands per octave (1 to 48)
Pitch
Frequency of the tuning pitch (A4 = 440.0Hz), 1Hz to 96000Hz.
Transpose
Determines how many semitones the frequencies will be transposed. (-24 to 24)
Scaling
Determines which which will be used to scale the frequencies:
- Linear
- Logarithmic
- Shifted logarithmic
- Mel (AIMP)
- Bark
- Adjustable Bark
- ERB
- Cams
- Hyperbolic Sine
- n-th Root
- Negative exponential
- Period
Skew factor
Affects any adjustable frequency scaling functions like hyperbolic sine and n-th root. Higher values mean a more linear spectrum.
Bandwidth
Distance between the low and high frequency boundaries for each frequency band. (0.0 to 64.0)
Filters page
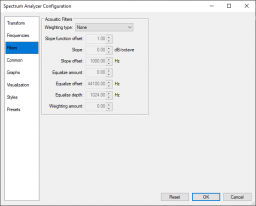
Acoustic Filters group
This group contains settings to allow you to apply acoustic weighting filters (A-, B-, C-, D- and M-weighting (ITU-R 468)) to the samples.
Weighting type
Selects the weighting filter type that will be applied.
Slope function offset
Slope function offset expressed in sample rate / FFT size in samples
Slope
Frequency slope offset
Slope offset
Frequency slope in dB per octave
Equalize amount
Equalization amount
Equalize offset
Equalization offset
Equalize depth
Equalization depth
Weighting amount
Weighting amount
Common page
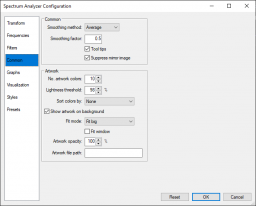
This page contains settings that the visualizations have in common.
Common group
Smoothing method
Determines how the spectrum coefficients and the peak meter values are smoothed.
- Average
- Peak
Smoothing factor
Specifies the strength of the smoothing (0.0 to 1.0)
Tooltips
Enable the check box to see a tooltip with the center frequency and when appropriate, the name of the note, of the frequency band.
Suppress mirror image
Prevents the mirror image of the spectrum (anything above the Nyquist frequency) from being rendered.
Artwork group
Some visualizations can use artwork to display on the background or to use as a source for a color list. The artwork can come from the playing track or from file location.
No. artwork colors
The maximum number of colors to select from the artwork.
Lightness threshold
Determines when a color is considered light. Expressed as a percentage of whiteness.
Sort colors by
Determines how to sort the colors selected from the artwork.
Show artwork on background
Displays the artwork on the graph background.
Fit mode
Determines how over- and undersized artwork is rendered.
- Free: The artwork will not be scaled.
- Fit big: Artwork that is bigger than the available area will be proportionally scaled.
- Fit width: The width of the artwork is scaled to fit in the available area.
- Fit height: The height of the artwork is scaled to fit in the available area.
- Fill: The width or height of artwork is scaled to fit the available area.
Fit window
Enable to use the full component window as available area instead of the client area (the window minus any room taken by axes)
Artwork opacity
Determines the opacity of the artwork when displayed.
Artwork file path
A fully-qualified file path or a foobar2000 script that returns the file path of an image to display on the graph background.
Graphs page
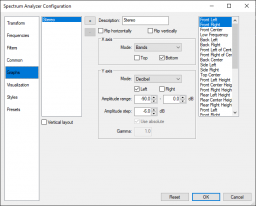
The component window can contains more than one graph at the same time. Some users use this to create facing spectrum analyses or to show a peak meter next to the spectrum analysis. Graphs can have individual settings but share the styles.
Graph list
The graph list shows all graphs in the current window. Use the + button to add a graph. Use the - button to remove the selected graph.
Vertical layout
Enables this setting to stack the graphs vertically instead of horizontally.
Description
Allow you to edit the description of the selected graph.
Flip horizontally
Flips the current graph horizontally. Any axes will be rendered accordingly.
Flip vertically
Flips the current graph vertically. Any axes will be rendered accordingly.
X axis group
Groups the parameters that determine the way the X axis is displayed.
Mode
Determines which X axis to display.
- None: Hides the X axis.
- Bands: Center frequency of a band, every 10 bands.
- Decades: Fixed frequency range
- Octaves: Frequency of the C note of each octave
- Notes: C note of each octave
Top
Displays an X-axis on top of the graph.
Bottom
Displays an X-axis at the bottom of the graph.
Y axis group
Groups the parameters that determine the way the Y axis is displayed.
Mode
Determines which Y axis to display.
- None: Hides the Y axis
- Decibel scale
- Logarithmic
Left
Displays an Y-axis on the left of the graph.
Right
Displays an Y-axis on the bottom of the graph.
Amplitude range
Determines the minimum and maximum amplitude, expressed in decibel (dB), to display.
Amplitude step
Determine the step size between the min. and max. amplitude.
Use absolute
Sets the min. amplitude to -∞ dB (0.0 on the linear scale) when enabled.
Gamma
Sets index n of the n-th root calculation.
Channels
Allows you to select the audio channels that will be used to calculate the transform or to measure the peak and RMS values.
Most users will enable only the left and right channel. No information will be shown in the graph when a mono track is played.
Visualization page
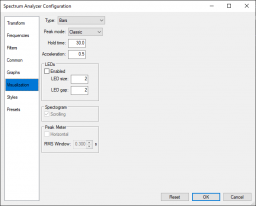
Type
Determines the type of visualization:
- Bars: The classic spectrum visualization
- Curve: The same as bars but with a smoothed curve instead of bars.
- Spectogram
- Peak Meter
Peak indicators group
Some visualizations can display indicators for the peak values. The following settings determine how those peak indicators are animated.
Peak mode
Specifies how the peak indicators are rendered:
- None
- Classic
- Gravity
- AIMP
- Fade Out
- Fading AIMP: A combination of AIMP and Fade Out
Hold time
Specifies how long a peak value will be held steady before it decays.
Acceleration
Specifies the acceleration used to decay the peak value.
LEDs group
Some visualizations can display a bar as simulated LED lights.
Enabled
Display the spectrum bars and peak meters as LEDs.
LED size
The size of the LED light, in pixels.
LED gap
The size of the gap between the LEDs, in pixels.
Spectogram group
Scrolling
Activates scrolling of the spectogram.
Peak Meter group
Horizontal
Renders the peak meter horizontally.
RMS window
Specifies the duration of each RMS measurement (in seconds).
Styles page
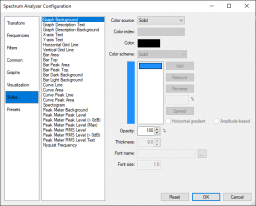
Colors
Click any of the colors to modify.
Color scheme
Specifies the color scheme used to render the spectrum.
   Solid color
   Custom
   Prism 1
   Prism 2
   Prism 3
   foobar2000
   foobar2000 Dark Mode
   Fire
Double-click a color to modify it. Modifying a color automatically selects the Custom color scheme. Press the Add' button to add a color, Remove to remove a color, Reverse to reverse the color scheme.
Band background
Enable the check box to see a background behind every band of the spectrum.
Presets page
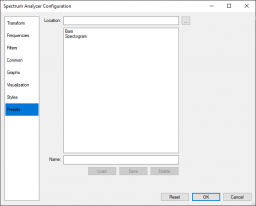
The whole configuration can be saved to a preset. A preset can be reloaded at any time.
Presets are not interchangeable with x86 and x64 versions of foobar2000. Special care is taken to be as backwards compatible with preset files saved by older versions of the component.
Preset files have fvsa as file extension.
Location
Contains the path name of the location of your preset files. By default the foobar2000 profile directory is used.
For privacy reasons the location is stored in your foobar2000 settings but will not be included in a preset file.
Below the location you find the preset files currently found in the specified location.
Double click a preset to activate it or select it and press the Load button.
Name
Specifies the name of the preset.
Load
Loads and activates the currently selected preset.
Save
Saves the current configuration.
Delete
Deletes the currently selected preset.
External links
- Spectrum Analyzer (foo_vis_spectrum_analyzer) on
 foobar2000.org
 - Discussion topic on
 hydrogenaudio
See also
- Frequency bands spectrum analyzer using either FFT or CQT on CodePen (on which part of this component is based).
