Constant-Q transform: Difference between revisions
m (FAKE component screenshot removed) |
(Added spectrogram image as spectrum images doesn't show time resolution) |
||
| Line 1: | Line 1: | ||
{{stub}} | {{stub}} | ||
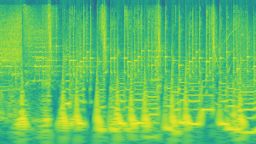
[[File:constant q transform.png|thumb|256px|A constant-Q spectrogram. Notice that lower frequencies (the bottom part) having horizontal/time-axis blur.]] | |||
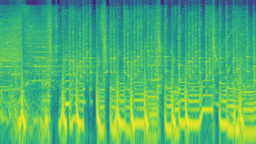
[[File:short time fourier transform.png|thumb|256px|In comparison, the constant-bandwidth version of Goertzel algorithm spectrogram have same time-axis blur for all frequencies (vertical slices), but it is blurrier in vertical axis at bottom part of the spectrogram.]] | |||
'''Constant-Q''' and '''variable-Q transforms''' ('''CQT/VQT''') are spectral analysis algorithms that usually have logarithmic frequency spacing and time/frequency resolution following octave series. Due to its usually logarithmic frequency resolution, it is suited for musical representation. | '''Constant-Q''' and '''variable-Q transforms''' ('''CQT/VQT''') are spectral analysis algorithms that usually have logarithmic frequency spacing and time/frequency resolution following octave series. Due to its usually logarithmic frequency resolution, it is suited for musical representation. | ||
| Line 7: | Line 9: | ||
The constant-Q transform can be constructed using multi-band Goertzel algorithm with each one has its own window size; lower frequencies have larger window size and vice versa, and with logarithmic frequency spacing (a 120-band Goertzels covering 20Hz-20kHz range and each band corresponds to musical notes). However, while the auditory perception are non-linear, it is not exactly logarithmic as the pitch perception is linear and constant-bandwidth at bass region. | The constant-Q transform can be constructed using multi-band Goertzel algorithm with each one has its own window size; lower frequencies have larger window size and vice versa, and with logarithmic frequency spacing (a 120-band Goertzels covering 20Hz-20kHz range and each band corresponds to musical notes). However, while the auditory perception are non-linear, it is not exactly logarithmic as the pitch perception is linear and constant-bandwidth at bass region. | ||
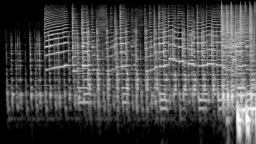
[[File:variable q spectrogram.png|thumb|256px|Variable-Q transform have benefits of better temporal resolution at lower frequencies (albeit with slightly bad frequency resolution at lower frequencies), just like traditional STFT while having pseudo-logarithmic resolution at higher frequencies.]] | |||
[[File:constant q spectrogram.png|thumb|256px|In comparison, the CQT version have poor time resolution on lower frequencies but it has sharper frequency-axis resolution than VQT version.]] | |||
Additionally, the gamma parameter can be used to gradually reduce the Q factor for lower frequencies to improve temporal resolution for that region. Alternatively, the band spacing can be set to perceptual frequency scales like Mel and Bark but it works best when the bandwidth is set according to '''abs(high - low)''' for each band. Either way, this becomes a variable-Q transform. | Additionally, the gamma parameter can be used to gradually reduce the Q factor for lower frequencies to improve temporal resolution for that region. Alternatively, the band spacing can be set to perceptual frequency scales like Mel and Bark but it works best when the bandwidth is set according to '''abs(high - low)''' for each band. Either way, this becomes a variable-Q transform. | ||
| Line 13: | Line 18: | ||
== List of audio applications that uses CQT == | == List of audio applications that uses CQT == | ||
* showcqt and showcwt filter in FFmpeg | * [https://ffmpeg.org/ffmpeg-filters.html#showcqt showcqt] and [https://ffmpeg.org/ffmpeg-filters.html#showcwt showcwt] filter in FFmpeg | ||
* [https://github.com/cnlohr/colorchord ColorChord] chromatic sound-to-light mapping system | * [https://github.com/cnlohr/colorchord ColorChord] chromatic sound-to-light mapping system | ||
* [https://codepen.io/TF3RDL/pen/poQJwRW Frequency bands spectrum analyzer using either FFT or CQT] (CodePen audio visualization project) | |||
[[Category:Technical]] | [[Category:Technical]] | ||
[[Category:Signal Processing]] | [[Category:Signal Processing]] | ||
Revision as of 05:02, 19 September 2023
This article is a stub. You can help the Hydrogenaudio Knowledgebase by expanding it.
Constant-Q and variable-Q transforms (CQT/VQT) are spectral analysis algorithms that usually have logarithmic frequency spacing and time/frequency resolution following octave series. Due to its usually logarithmic frequency resolution, it is suited for musical representation.
Overview
More details are available on a Wikipedia page about the same topic.
Usually, the FFT are linearly-spaced in frequency and are constant-bandwidth, which is better suited for perfect reconstruction, however, due to the fact musical notes are logarithmically-spaced and how auditory perception works, the FFT is not suited for anything musical even though it is used in some RTA analyzers.
The constant-Q transform can be constructed using multi-band Goertzel algorithm with each one has its own window size; lower frequencies have larger window size and vice versa, and with logarithmic frequency spacing (a 120-band Goertzels covering 20Hz-20kHz range and each band corresponds to musical notes). However, while the auditory perception are non-linear, it is not exactly logarithmic as the pitch perception is linear and constant-bandwidth at bass region.
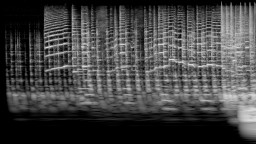
Additionally, the gamma parameter can be used to gradually reduce the Q factor for lower frequencies to improve temporal resolution for that region. Alternatively, the band spacing can be set to perceptual frequency scales like Mel and Bark but it works best when the bandwidth is set according to abs(high - low) for each band. Either way, this becomes a variable-Q transform.
Although FFT itself can be used in conjunction with frequency-domain kernels, calculating a CQT directly is slow even with Goertzel algorithm unless a sliding DFT is used.
List of audio applications that uses CQT
- showcqt and showcwt filter in FFmpeg
- ColorChord chromatic sound-to-light mapping system
- Frequency bands spectrum analyzer using either FFT or CQT (CodePen audio visualization project)
